
Tutorials
UCAYALI RIVER CASE
1. Export river centerline information
- Transform the river centerline into points with X–Y coordinates
- Save the attribute table as an Excel file.
- Delete all the columns except those that contains the XY coordinates
- Save the file as Text (tab delimited).
- In this case a channel from the Ucayali River used as example. You can download the txt file from here (UcayaliRiver.txt).
2. Open file
- Click on File menu and open the .txt file
- Introduce the average width of the channel (In this case, introduce a value of 700)
- Press “Ok”
- MStaT will give you the option to incorporate a background image, in this case, we choose the option ‘No’.
 3. Results
MStaT will show the river with its inflection points and the valley centerline. In the upper zone, there is a chart with the information of every meander. We can select the number of the meander we want to see and press “Go” to show the information.

The parameters that are considered are: Sinuosity, Arc-wavelength, Wavelength, Amplitude, Upstream Length and Downstream Length.

4. Tools
Tool menu, there are two options: “Wavelet Analysis” and “River Statistics”.
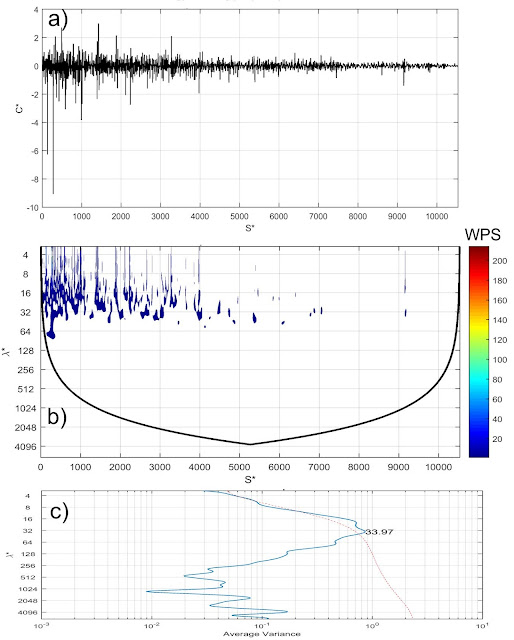
[a]. Wavelet Analysis:
The first option shows four graphics related to the wavelet analysis.

a.1. Filter options and export figures
In this screen, there are two options in the upper bar.
a). Filter: This option allows selecting the values or range of values that the user wants to see specifically. It can be filtered by writing the min or max value of Arc-Wavelength or Sinuosity.

b). Export Figures: In this option, the user can export the figures created from the wavelet analysis. First, the user have to select the graphic to export.

A new screen will appear. In this screen the user can select the items that will appear in the graphic (colorbar and legend).

The option Export Setup, in the file menu, allows to change some preferences to export the graphic (size, rendering, fonts, lines). Then press Export.

In the next screen, the user needs to select the type of file to export. The next options can be selected:

[b]. River Statistics:
This option generates a table with the information of each meander.

a). Export output files: Finally, to export the information from the processing, MStat give the option to export as: Matlab file (.mat), Excel file (.xls), KMZ File (.kmz) or Graphics (.tif).

whay there is NaN ?
ReplyDeleteNo existe
Delete